Creating a Graphical Function
A graphical function displays a relationship between an input (which itself can be an algebraic relationship) and an output.
You can choose to define the graph's input by specifying an equation, or you can use the default equation (Time).
You may have a time series of data, like sales per month, or average temperature per month. In these examples, the value shown in the graph is dependent on time. In other cases, you might have a graph where the value is dependent on other variables. For example, the death rate for an animal population is dependent on the availability of food, the productivity of a worker is dependent on the number of hours worked, etc.
You can define a graph for a flow or converter.
To Create a Graphical Function
- In the model, select the flow or converter which you want to define as a graphical function.
- On the Equation tab, define the graphical function's input by entering
an equation in the Equation box. To use the default equation (TIME), leave
the Equation box blank.
- On the Graphical Function tab, select the Graphical check box.
- On the Graphical Function tab's Graph tab, enter the minimum and maximum values for the X-axis. Use the slider beneath the graph to zoom in or out.
- Use the two boxes to the left of the graphical function grid to specify the minimum and maximum values for the Y-axis. And the two boxes at the bottom to specify the minimum and maximum values for the X-axis.
- In the Data Points box, specify the number of data points, or use the up or down arrows to increase or decrease the value.
- Optionally, to get an initial set of points click on one of the preset shapes, then adjust the curvature to meet your needs.
- Use one (or a combination) of the following procedures to define the values for the data points:
- On the Graph tab, click and drag to draw a curve that represents the function. As you draw the curve, the software determines the values associated with each data point in the curve.
On the Points tab, use the table to specify the value for each data point in the function.
Notes: To specify values for the X-axis (in the first column), first click  (above the column) to unlock the column, then type the values.
You can paste values that you've copied from another source into either column. For more information, see Importing and Exporting Data with Copy and Paste.
- At the bottom of the Graphical Function panel, click the appropriate picture to select the type of graphical function you want to use: Continuous, Continuous extrapolation, or Step. For more information about these options, see Graphical Function Tab.
- When you're finished defining the graphical function, click
 in the bottom-right corner of the panels.
To Define a Separate Graphical Function for Each Element
When you define a graphical function for an arrayed flow or converter and you clear the Apply To All check box, you need to specify a separate graphical function for each combination of dimensions and elements in the array.
For example, if the array has two dimensions, and one dimension has three elements and the other has four elements, you need to specify 12 separate graphical functions. Similarly, if the array has three dimensions, and one dimension has two elements, one has three elements, and one has four elements, you need to specify 36 separate graphical functions.
- Select the arrayed flow or converter for which you want to define separate graphical functions.
-
Clear the Apply To All check box on the Graphical Function panel.
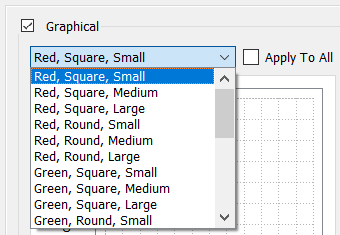
A dropdown will appear showing all the different array element combinations:

Select any combination from the list to work on the associated curve.
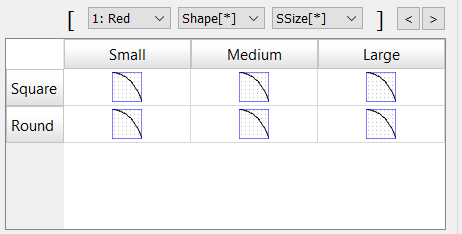
A table will also appear at the bottom of the Graphical Function panel so that you can see the graphical functions for up to two dimensions at a time.
The row of boxes above the table indicates the combination of elements and dimensions you're currently editing.
In the following example, the table lets you define the graphical functions for the "Shape" and "SSize" elements for the "Red" color of the first dimension.

-
To define a graphical function for any cell in the table, click the cell, then use the options at the top of the Graphical Function panel to define the graphical function for the cell (see steps 4-9, in the previous procedure).
-
When you've finished defining the graphical functions for the currently displayed combination of elements and dimensions, click the  button to display the next combination of elements and dimensions.
Tip: You can move backwards through the displayed element/dimension combinations by clicking the  button.
-
Repeat steps 3-4 until you've defined graphical functions for each element/dimension combination.
Tip: You can define a graphical function for a specific element/dimension combination by selecting the elements you want in the boxes above the table. The table adjusts to display the appropriate cells, where you define the graphical function for the selected elements.
To Delete a Graphical Function
-
In the model, select the converter or flow whose associated graph you want to delete.
- On the Graphical Function tab, clear the Graphical check box.
 See Also
(above the column) to unlock the column, then type the values.

