Working with graphs and tables

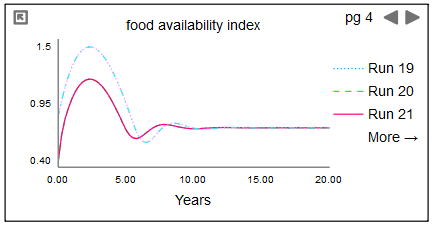
When you add a graph or table to the diagram, you can move, resize, minimize, and turn pages in the graph or table you add. This works in the same way for both tables and graphs.
- Click within the object's border. The object will be highlighted and resize handles will appear.
- When the Move cursor appears, drag the object to a new location.
- Drag the resize handles to resize the object.
- With the object selected, specify properties in the Properties panel.
Turning pages
To change pages on a graph or table:
- The page buttons will appear only if there's more than one page.
- Click the Previous page
 button to go to the previous page. If you're on the first page, the last page will appear.
- Click the Next page
 button to go to the next page. If you're on the last page, the first page will appear.
- The current page number appears just to the left of the buttons.
Minimizing graphs or tables
To minimize a graph or table:
- Click the
 button in the upper left hand corner of the table or graph. The table or graph will be replaced by the table or graph icon, as shown below.
- Double-click the icon to restore the table or graph.

Minimized table and graph
Managing data in graphs and tables
- If you create a comparative graph or table and run sensitivity (or optimization resulting in sensitivity results) there will be an option to see all sensitivity parameters. See Sensitivity Parameters dialog (Model Only) for further discussion.
- When you export data you can export the contents of tables, and retain the table settings. See Importing and Exporting Data for more discussion.
- When you designate a graph or tables as stashing data, there will be a button to stash the current run. See Stash Data for more discussion.
 See Also


 button to go to the previous page. If you're on the first page, the last page will appear.
 button to go to the next page. If you're on the last page, the first page will appear.
 button in the upper left hand corner of the table or graph. The table or graph will be replaced by the table or graph icon, as shown below.