Use the causal lens to see the behavior of a variable, and the things that contribute to that variable's behavior. The Causal lens displays a comparative graph with raw scaling, so you can see what changed and when it changed, as clearly as possible.
To open the Causal Lens, select Open Causal Lens from the Window menu, or click on ![]() in the toolbar. If you're currently editing a variable, it will open on that variable; otherwise, you'll be asked which variable to open on. If the current variable is arrayed, you'll be asked to select an element.
in the toolbar. If you're currently editing a variable, it will open on that variable; otherwise, you'll be asked which variable to open on. If the current variable is arrayed, you'll be asked to select an element.
The Causal Lens will open:
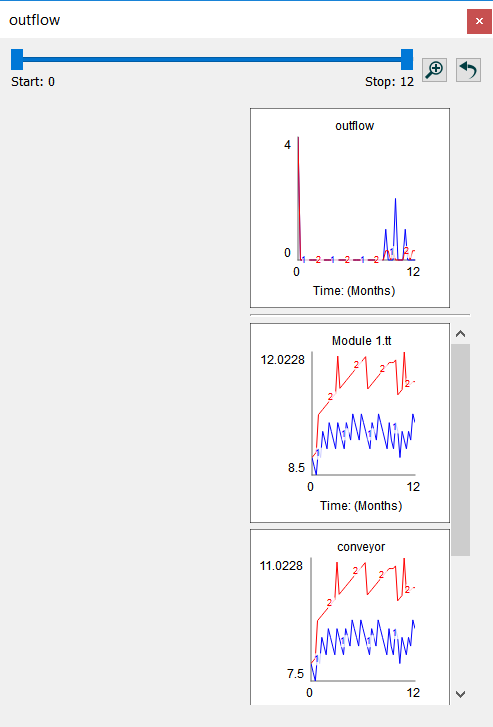
The Causal Les shows a variable, and the other variables that cause it. If there are a large number of causes, there will be a scroll bar to make all of them visible. For flows, implicit causes that result because of non-negativity or capacity constraints will be shown.
Drag the handles of the slider (![]() ) to change the time range over which values will be displayed. You can Narrow this range are much as you like by dragging these handles toward one another. After doing this click on
) to change the time range over which values will be displayed. You can Narrow this range are much as you like by dragging these handles toward one another. After doing this click on ![]() to refine the granularity of the handle movement. Repeating this will allow you to view values at specific DTs. Click on
to refine the granularity of the handle movement. Repeating this will allow you to view values at specific DTs. Click on ![]() to view values for the entire run. The range viewed applies to all graphs displayed in the Causal Lens.
to view values for the entire run. The range viewed applies to all graphs displayed in the Causal Lens.
You can scrub across a graph by dragging. As you do this, the values for all the graphs in that column will be displayed.
Click on any of the causes to see its causes in turn. The graphs will appear to the left. The graph you clicked on will remain highlighted to help you visualize the path of causality.
If you click on something in the Causal lens that is already displayed, you will see a message:
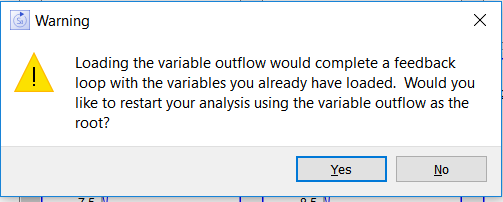
Clicking yes will clear the content of the Causal lens, and display the indicated variable and its causes. Clicking no will continue to add content to the causal lens.