Use a graphical input to add a graph to your model.
You can use the graph to display whatever variables you want, in a way that may be more explanatory than a list of numbers.

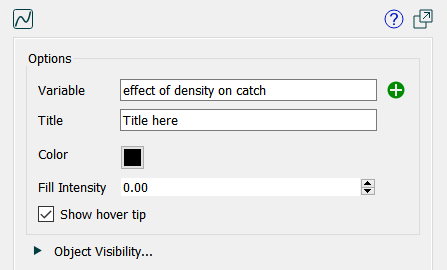
Variable specifies the variable(s) that will be displayed on the graph.
Title specifies what title will be displayed under the graph.
Color determines the color that the graph line will be drawn with. The default is black.
Fill Intensity determines what the appearance will be of the area below the graph line. This is a number between 0 and 1. By default this is 0, so only the graph line is visible. You can achieve different effects by setting to, for example, 0.5

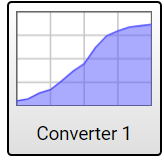
The color and fill intensity are used for both the button on the interface and the dialog that opens when you click on the button.
Show hover tip, if specified, will display the x and y values of the points as the user drags the curve. This is especially useful for discrete graphicals.
Though it has a somewhat different appearance, the graphical input functions the same way that it does for model construction, as described in Graphical Function Tab discussion.
The graphical input will appear as:

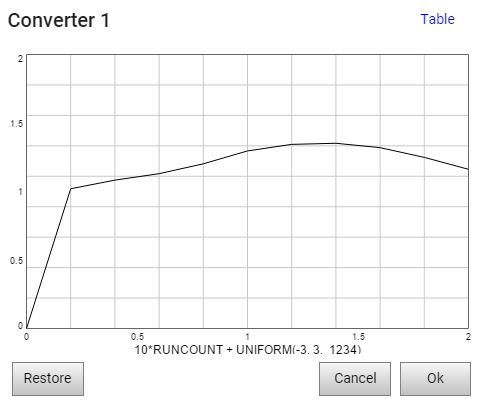
Click on it to open the graphical input editor:

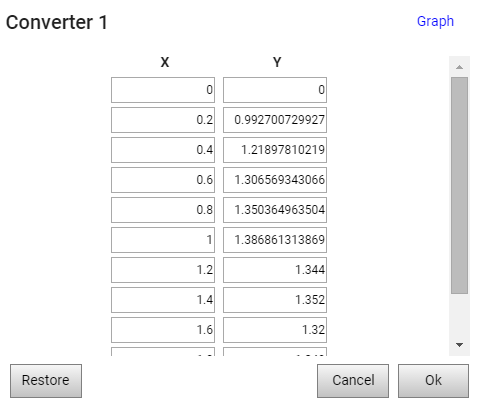
You can drag individual points or trace along a line to change the shape of the curve. By clicking on the Table link in the upper right hand corner, you can enter values as x,y pairs:

The Restore button will restore the graphical to its original value (either model defined or imported). Okay will accept your changes, and Cancel will throw them away.